
It never seizes to mesmerize me how Simon sees math. So many times has he solved math problems or proved theorems relying on visual, geometric illustrations instead of bluntly applying memorized formulae. So many times has he explained complex and abstract math concepts with simple drawings. Sometimes, I would walk into the bathroom and see this:
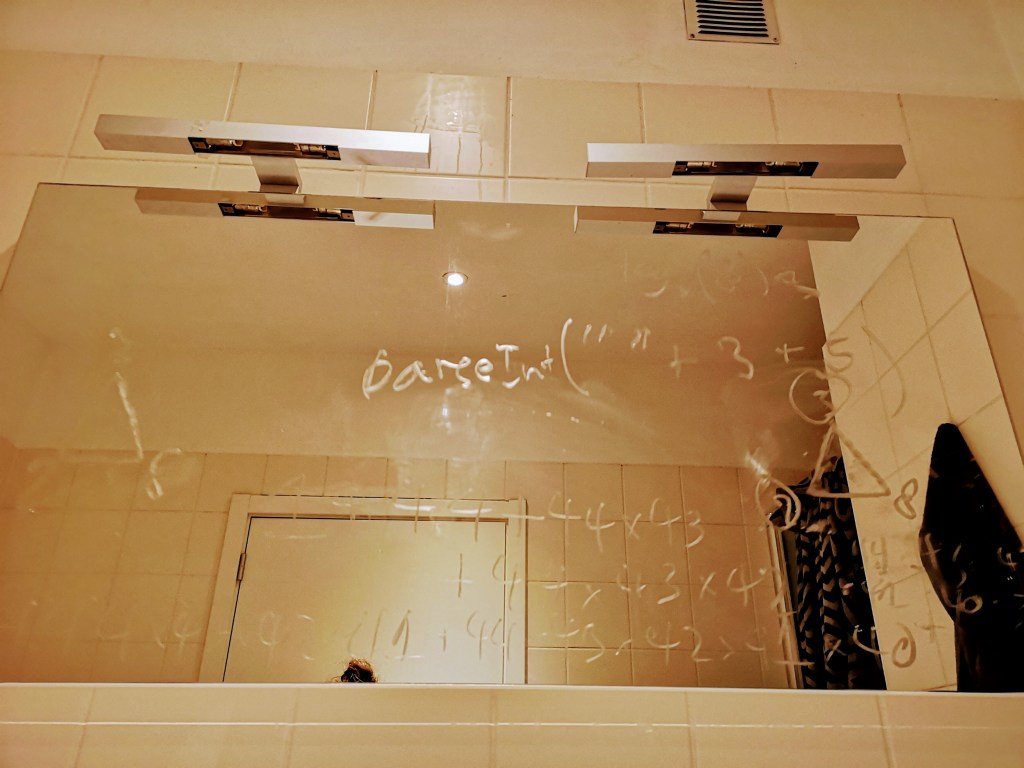
I left the bathroom having grasped logs, my nemesis, a little better. If you look closely, you will see a modest little triangle in the top left corner. Every vertex of the triangle represents a power operation: root, power, log:

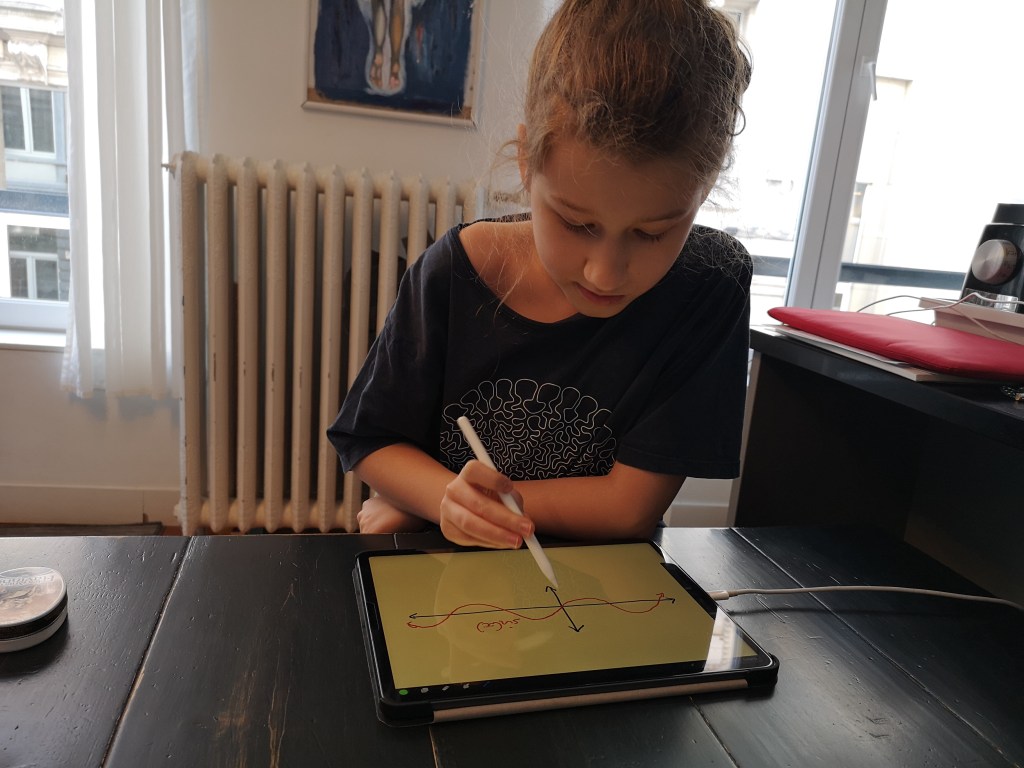
Simon loves sharing his vision, sometimes overwhelming the listeners, I admit. During the kickoff session of his new World Science Scholars course (Planetary Scale Ocean Circulation with David Holland, about applying math to studying ocean and climate dynamics) he slightly hijacked the stage trying to show visual ways to understand the main postulates in derivative calculus. Eventually, he was politely asked to create a YouTube video for everyone to see at their own pace. So this is what he came up with:
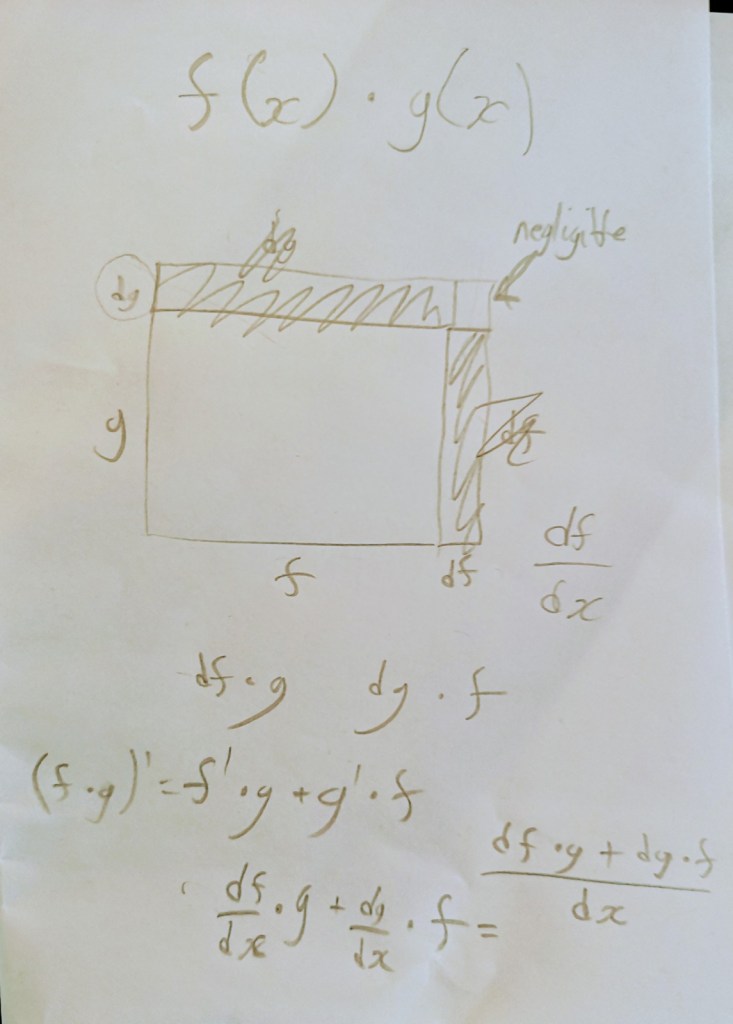
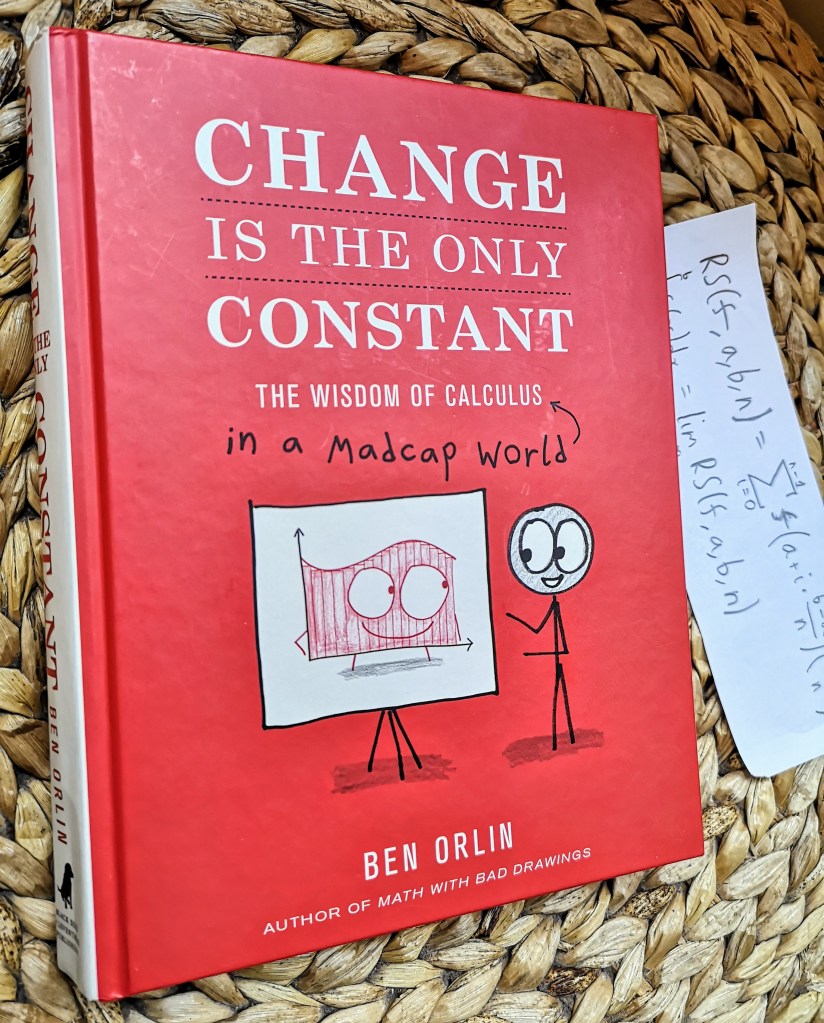
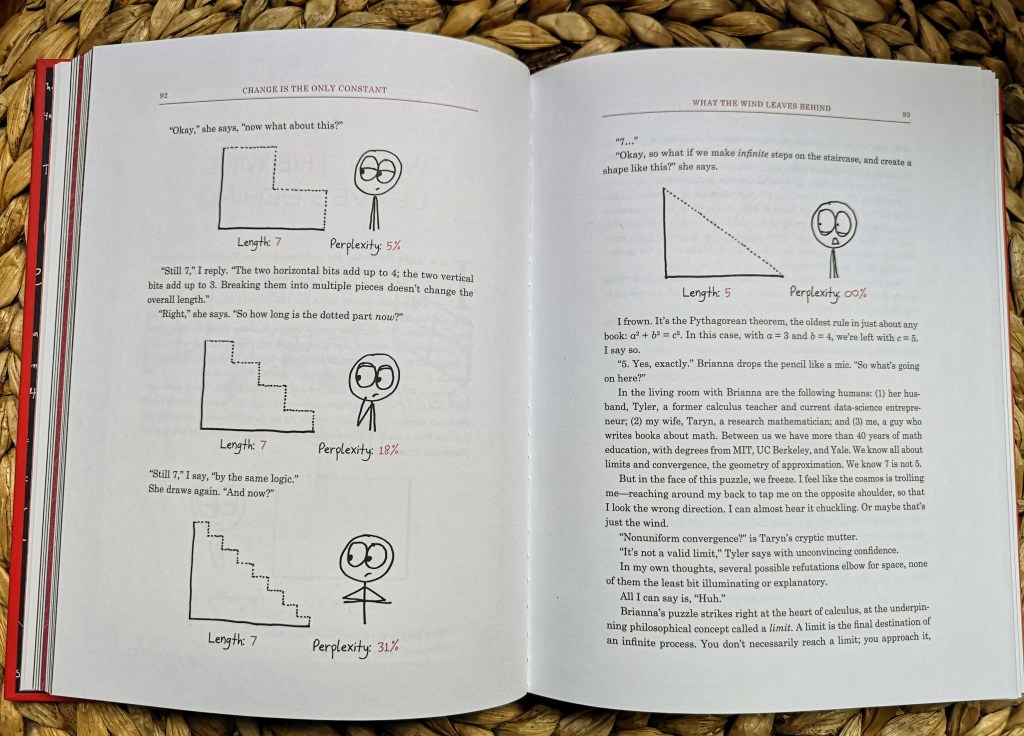
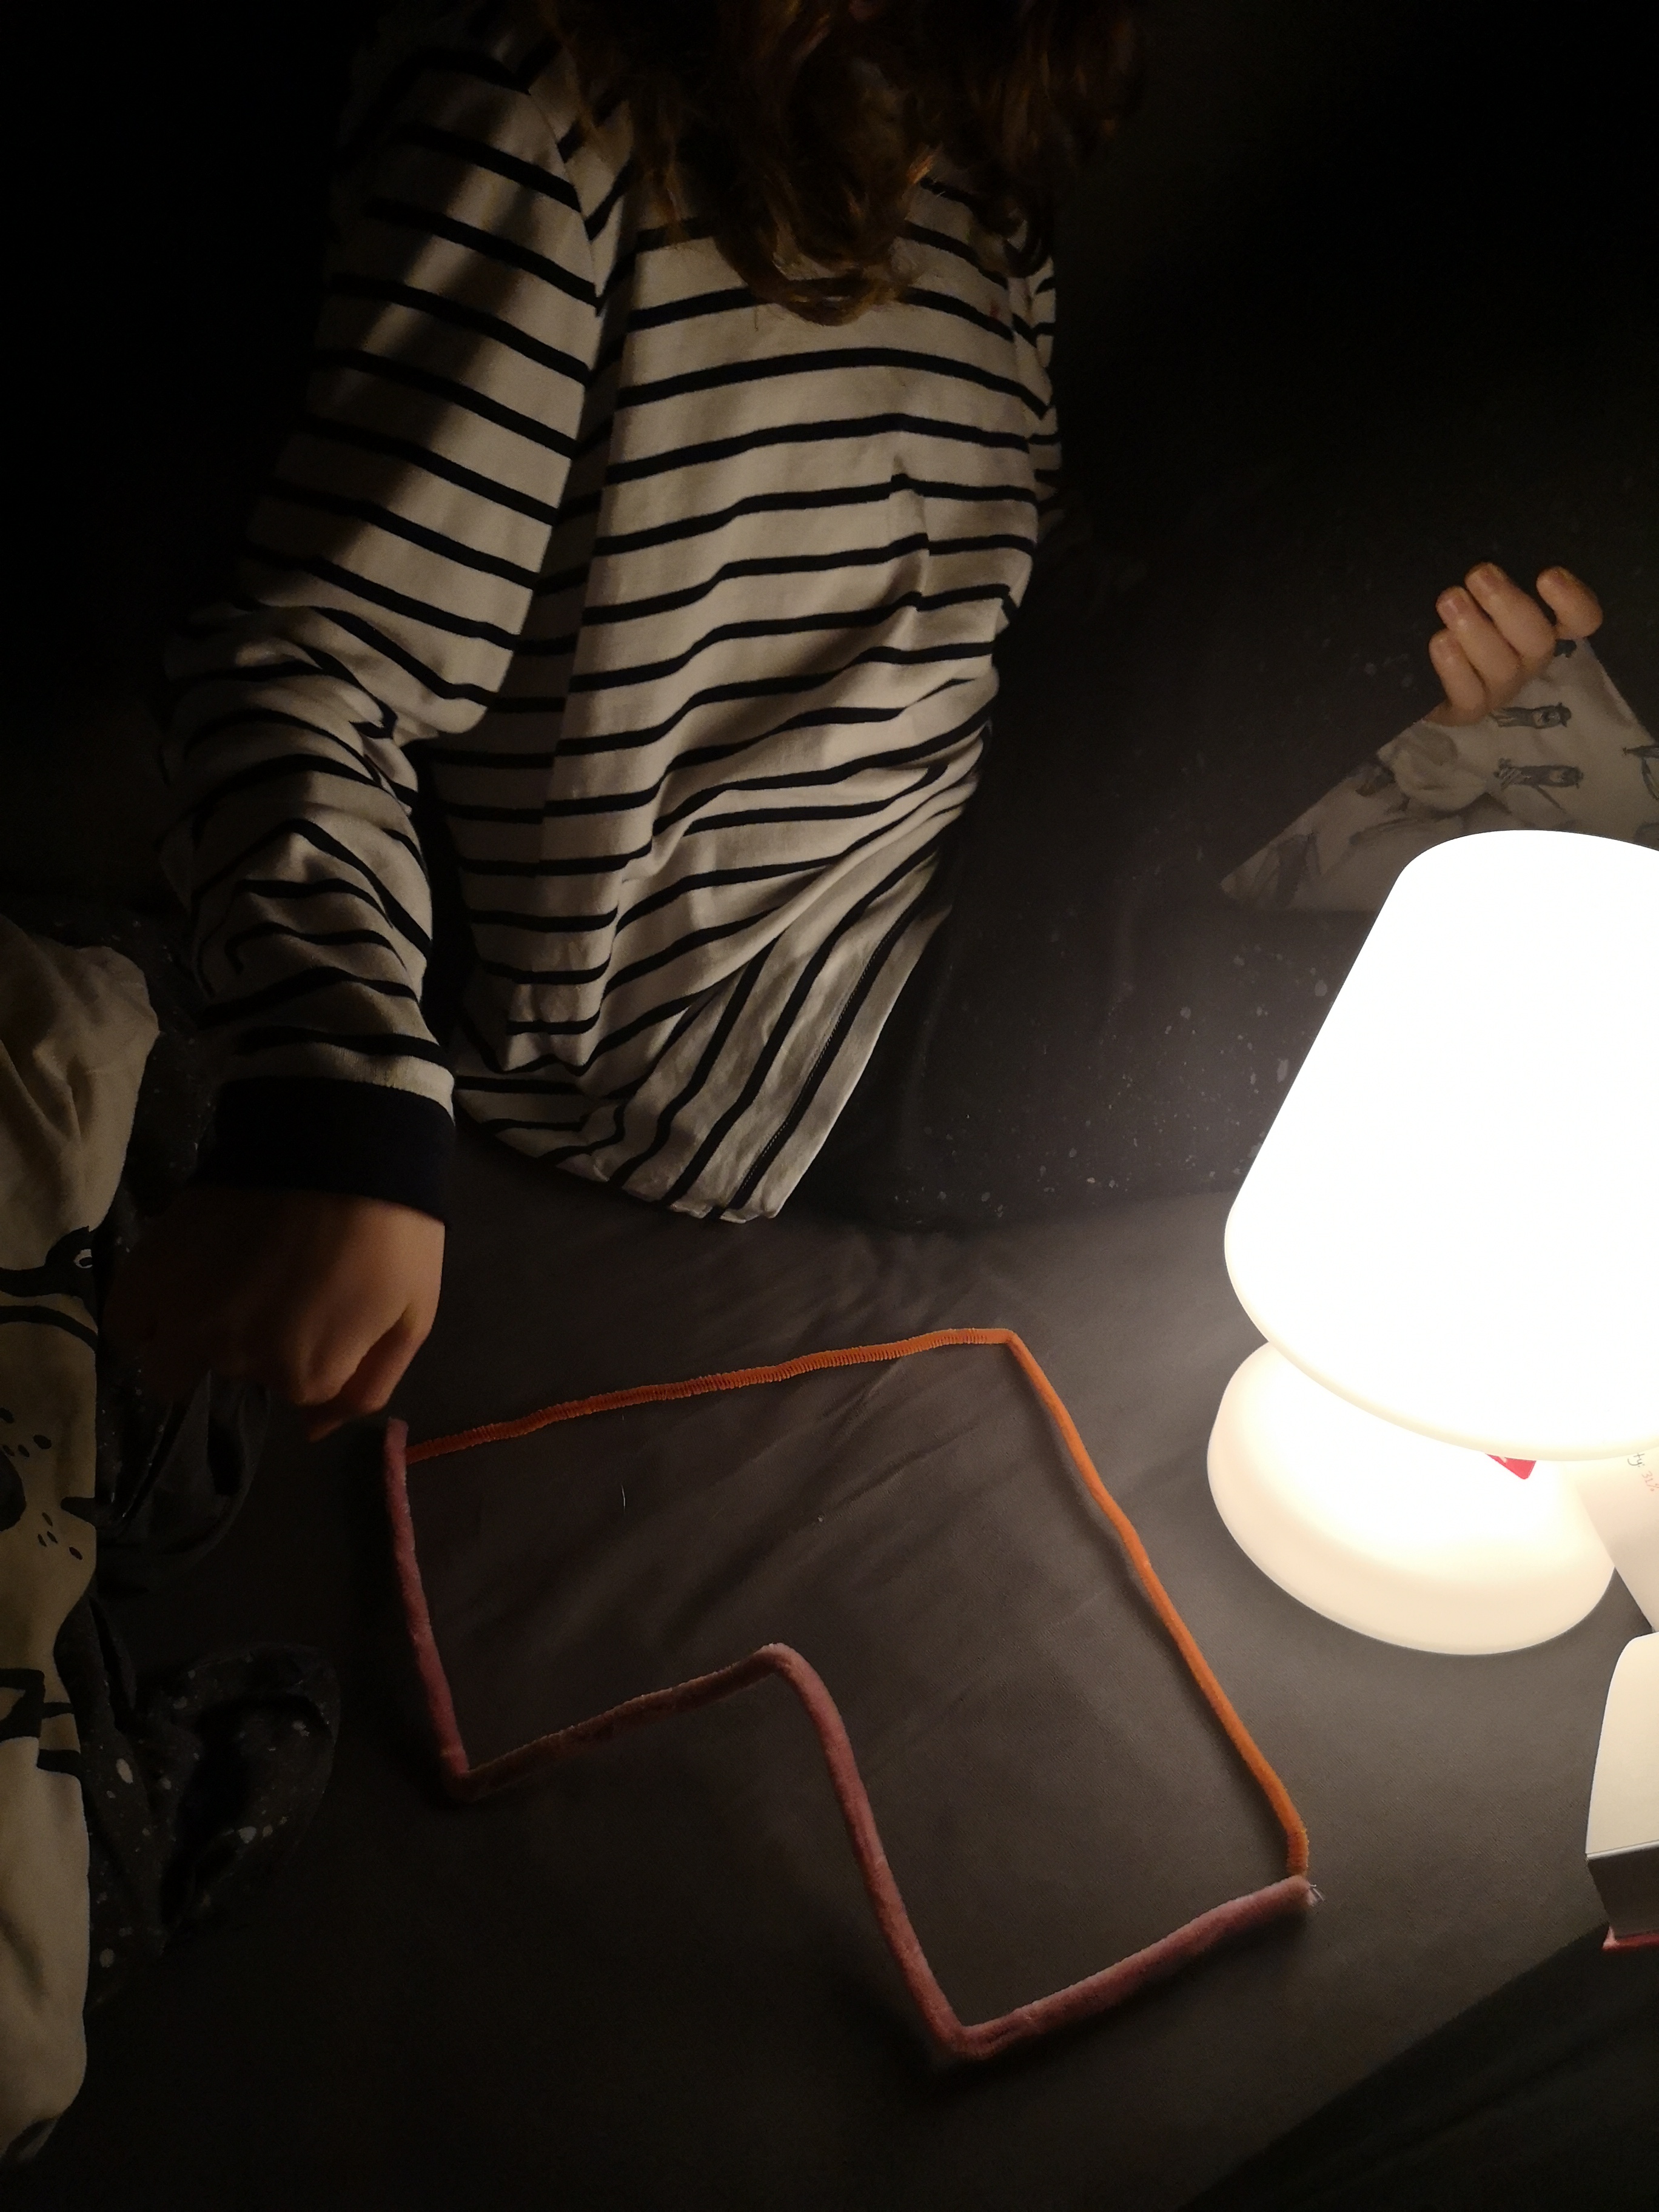
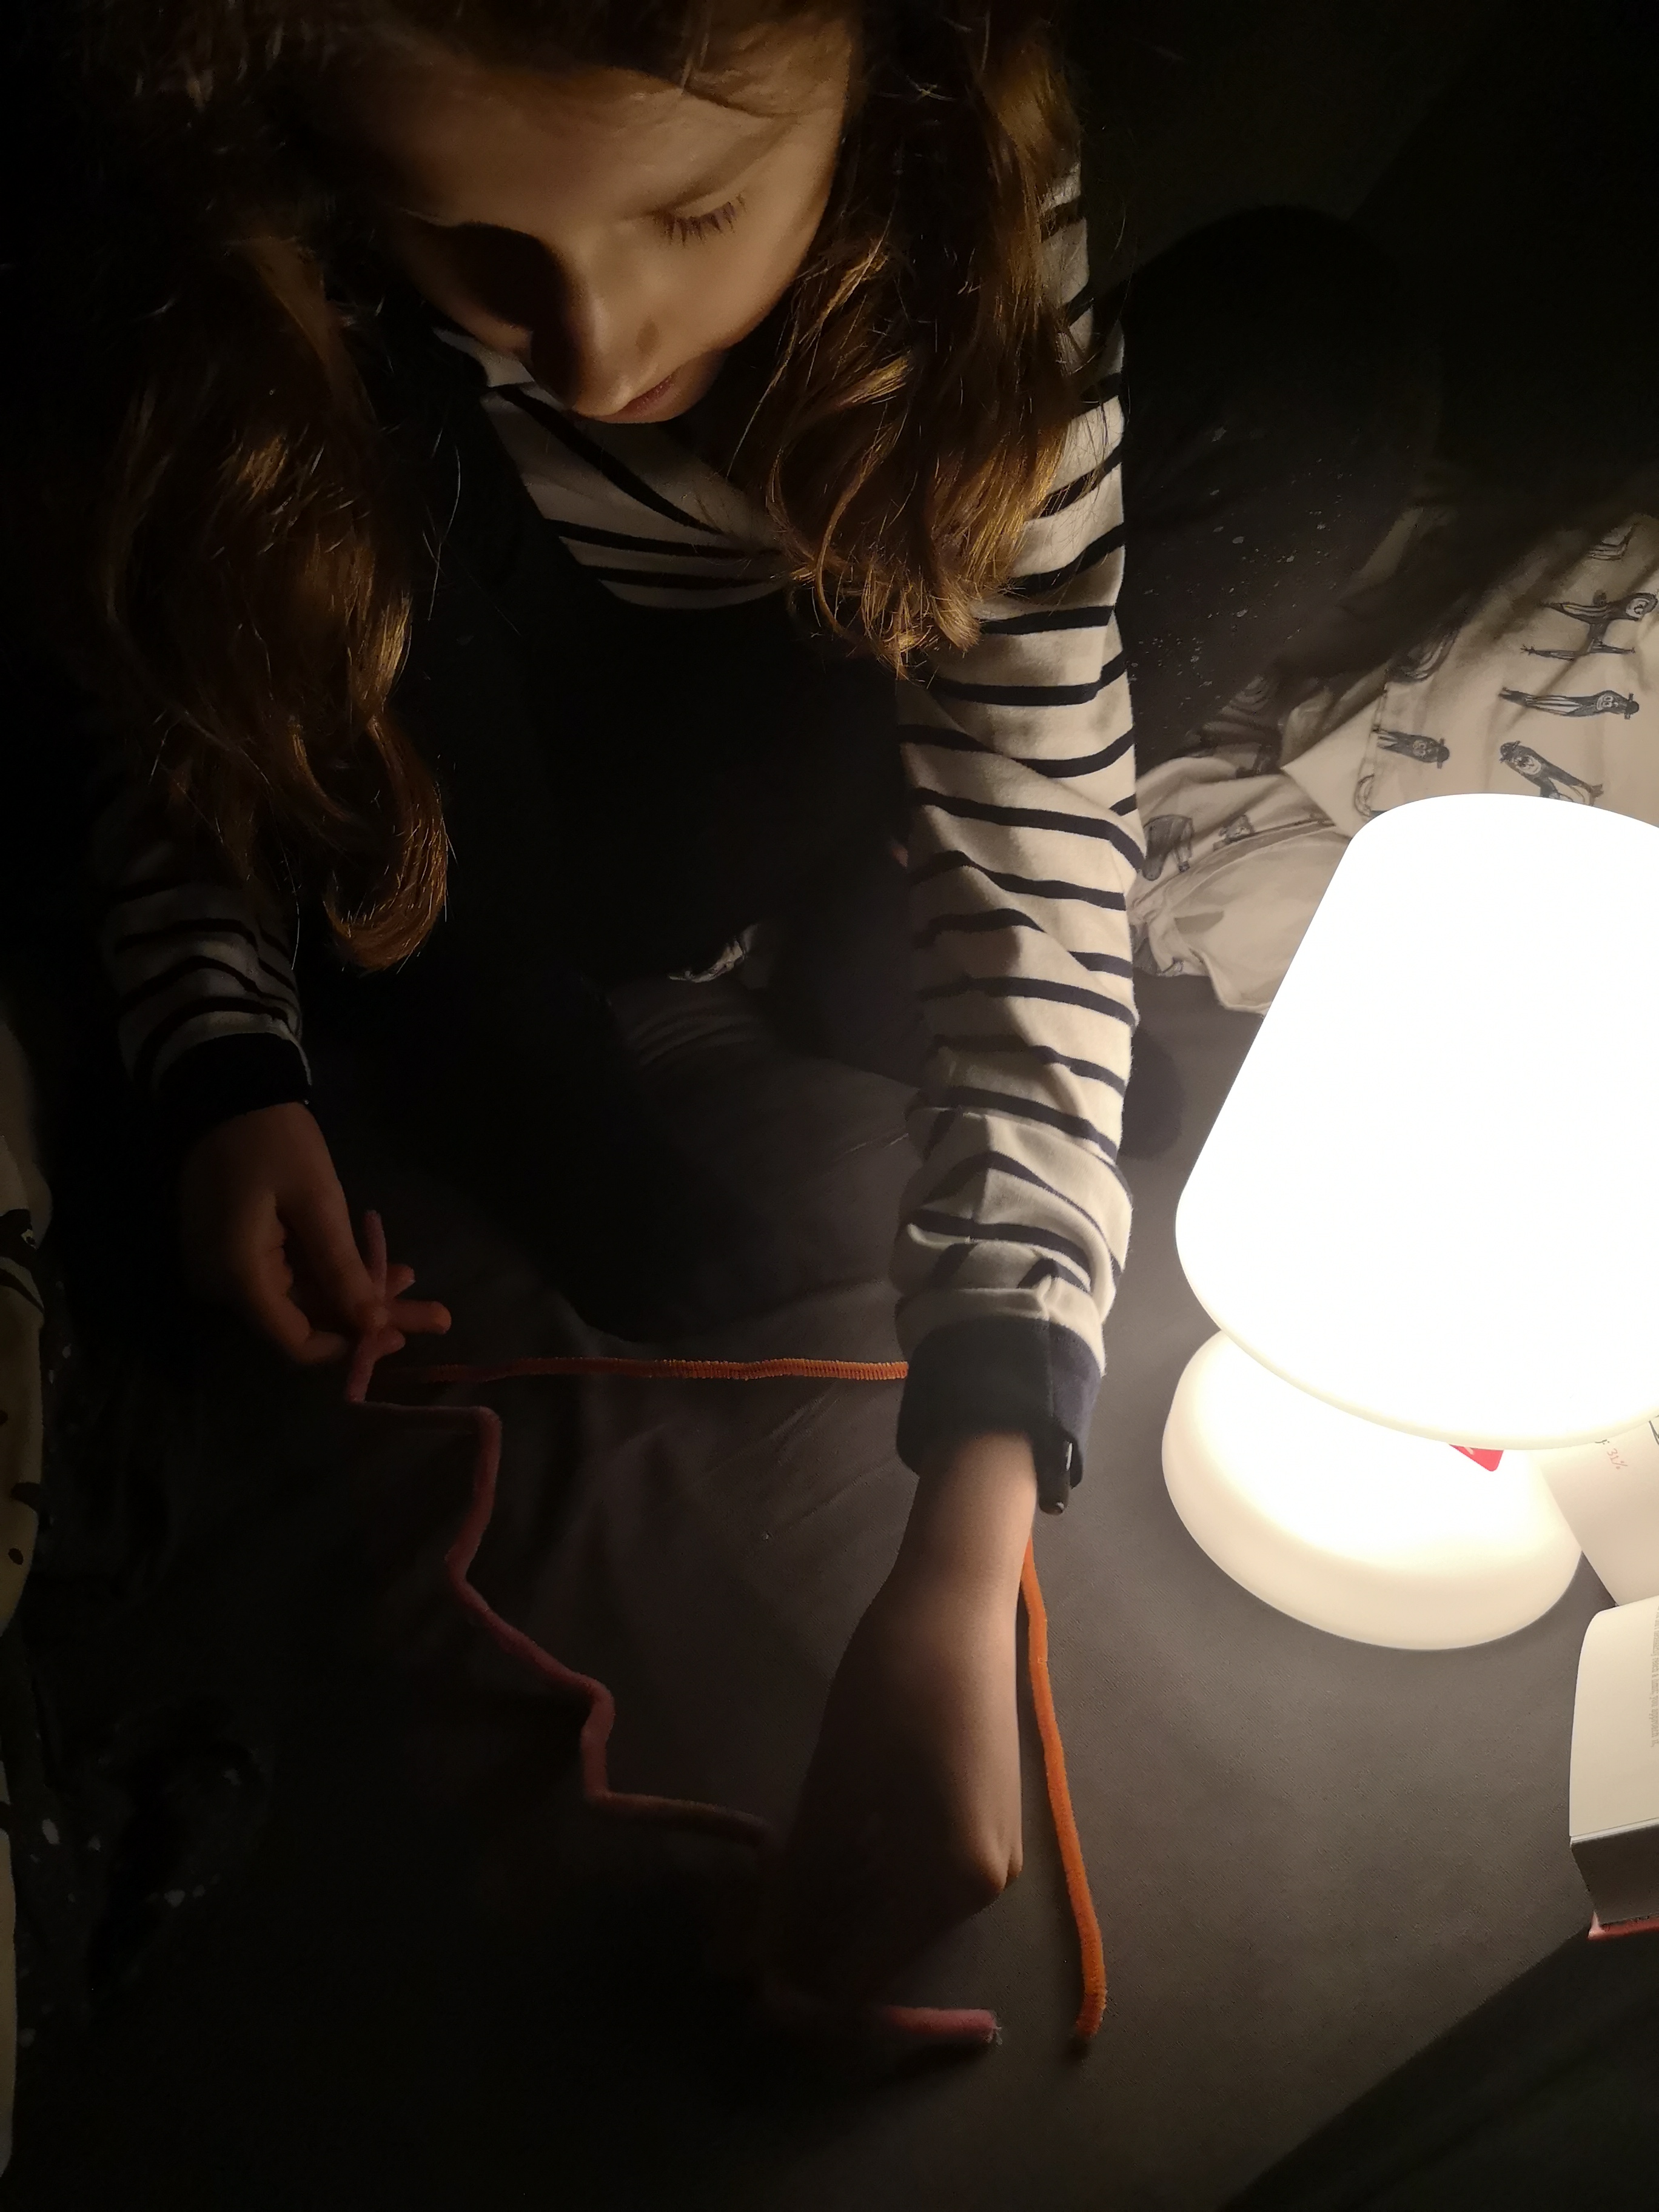
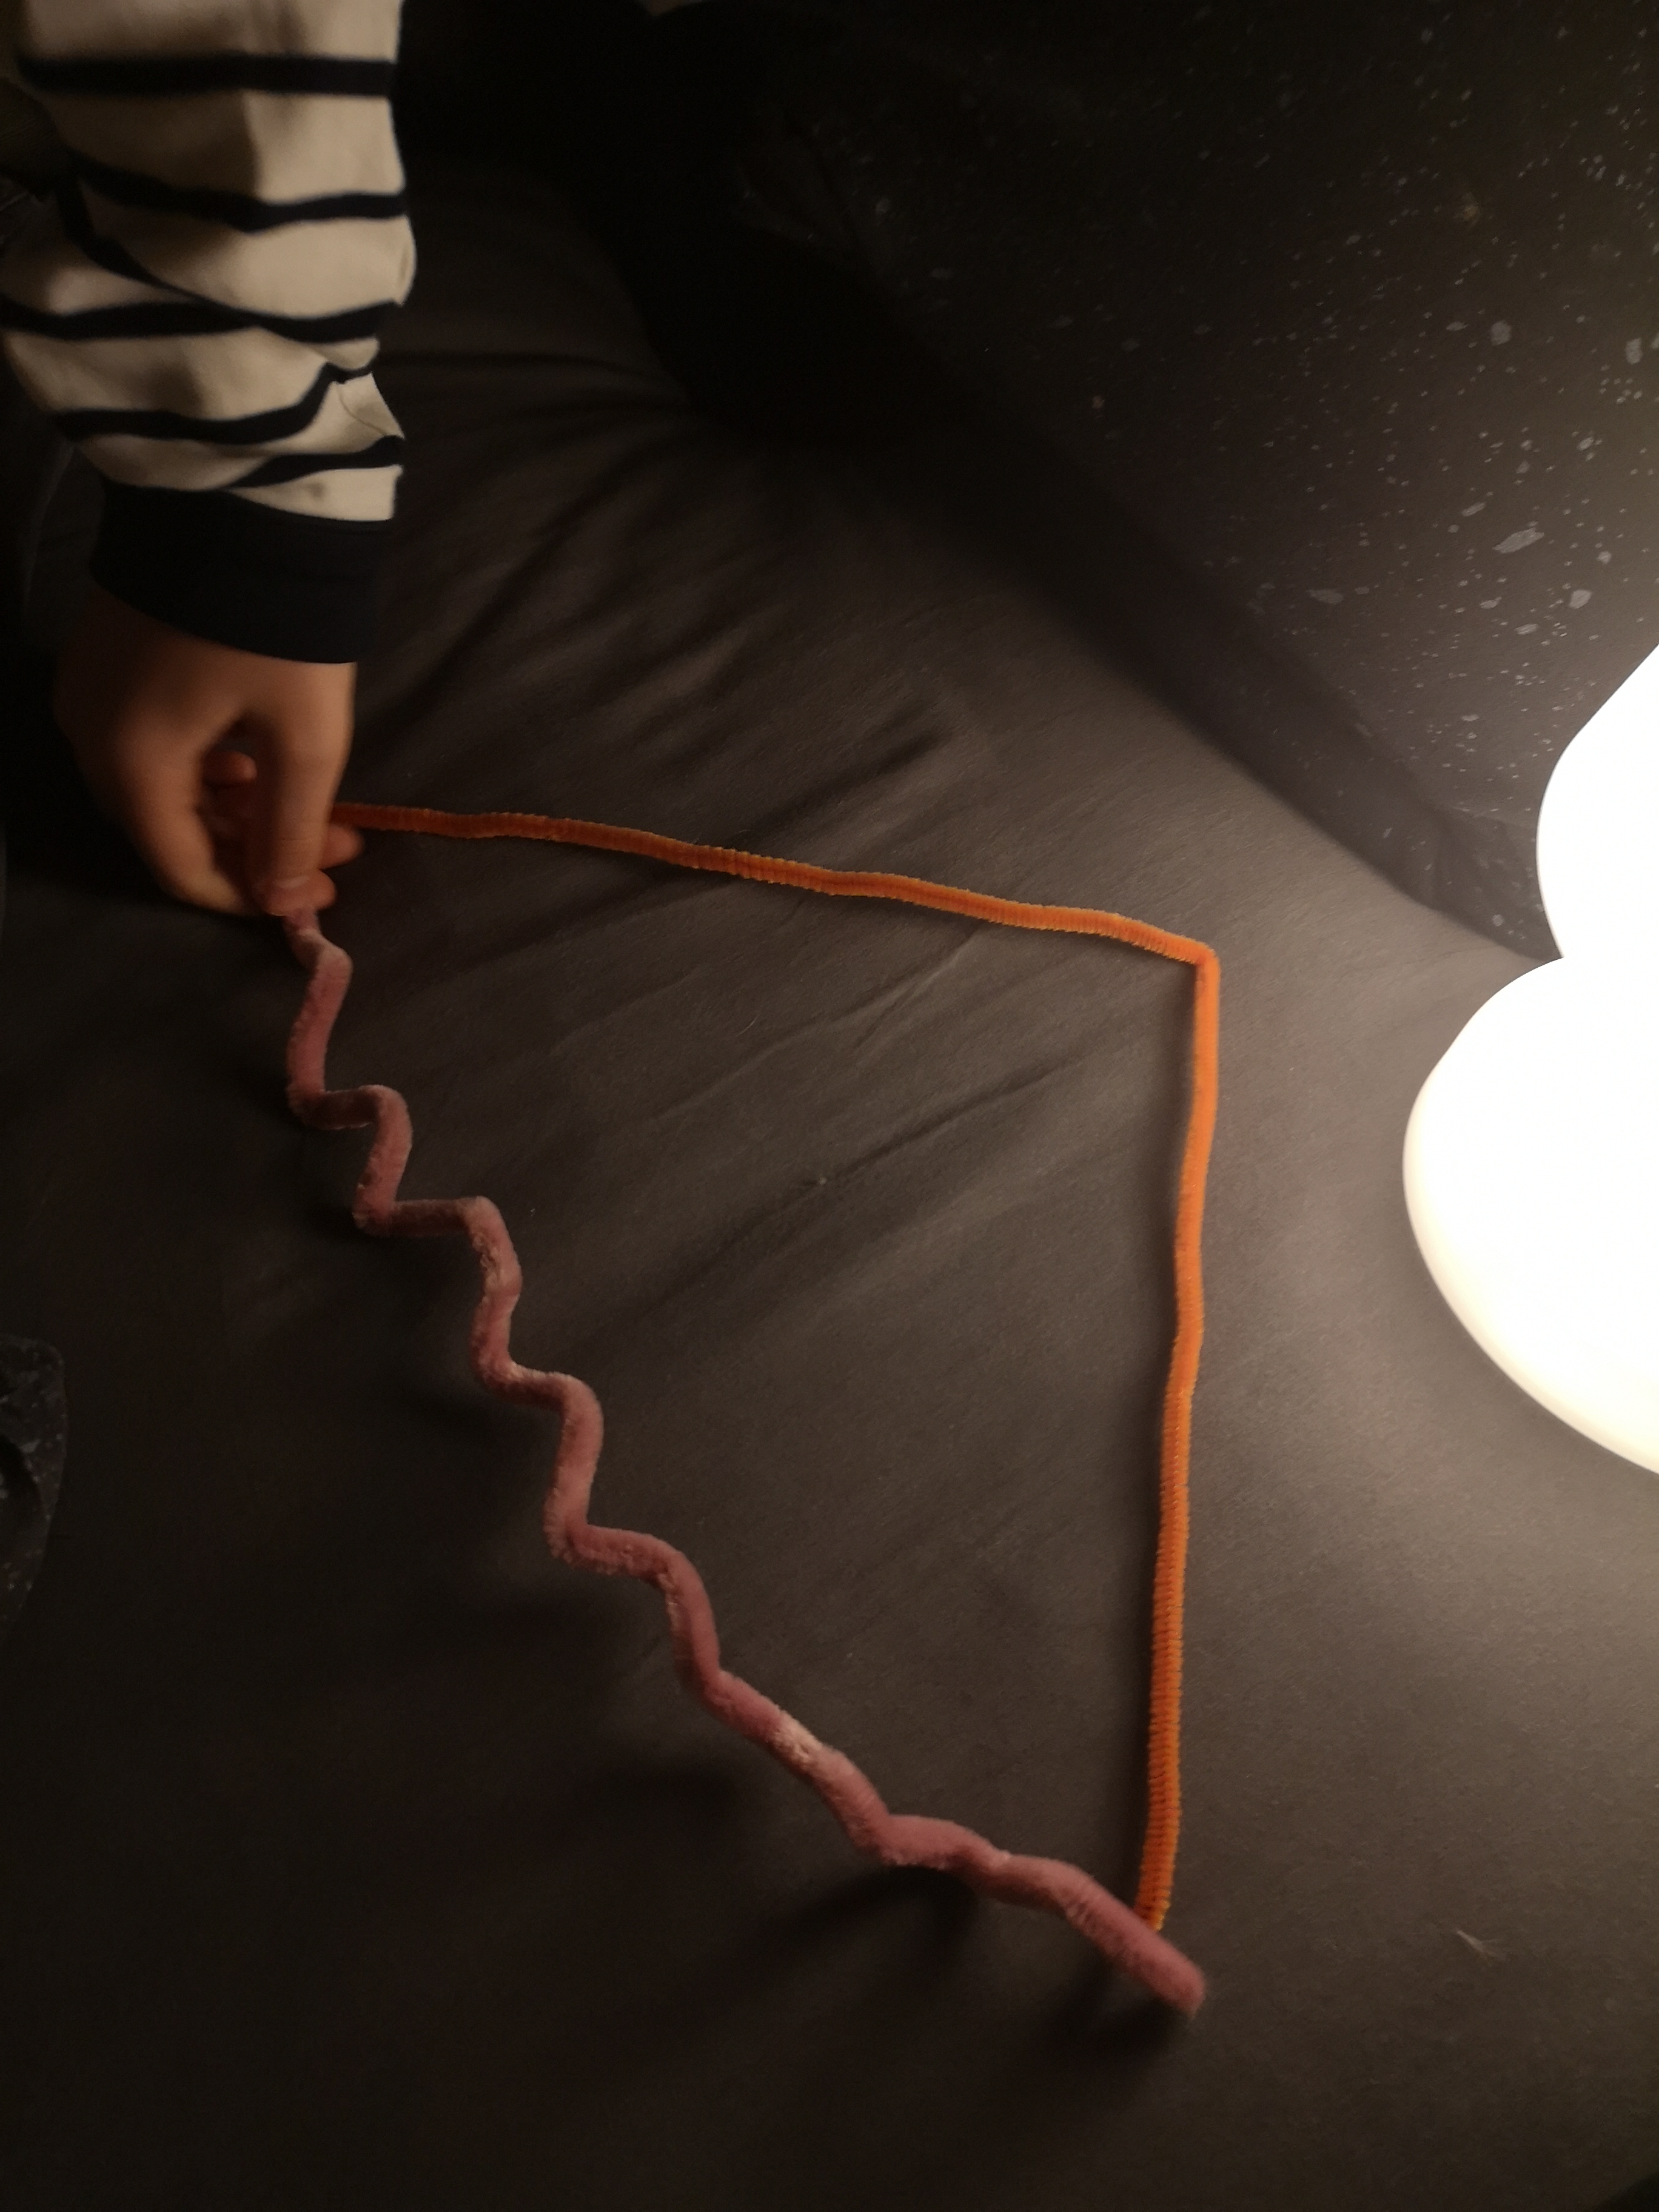
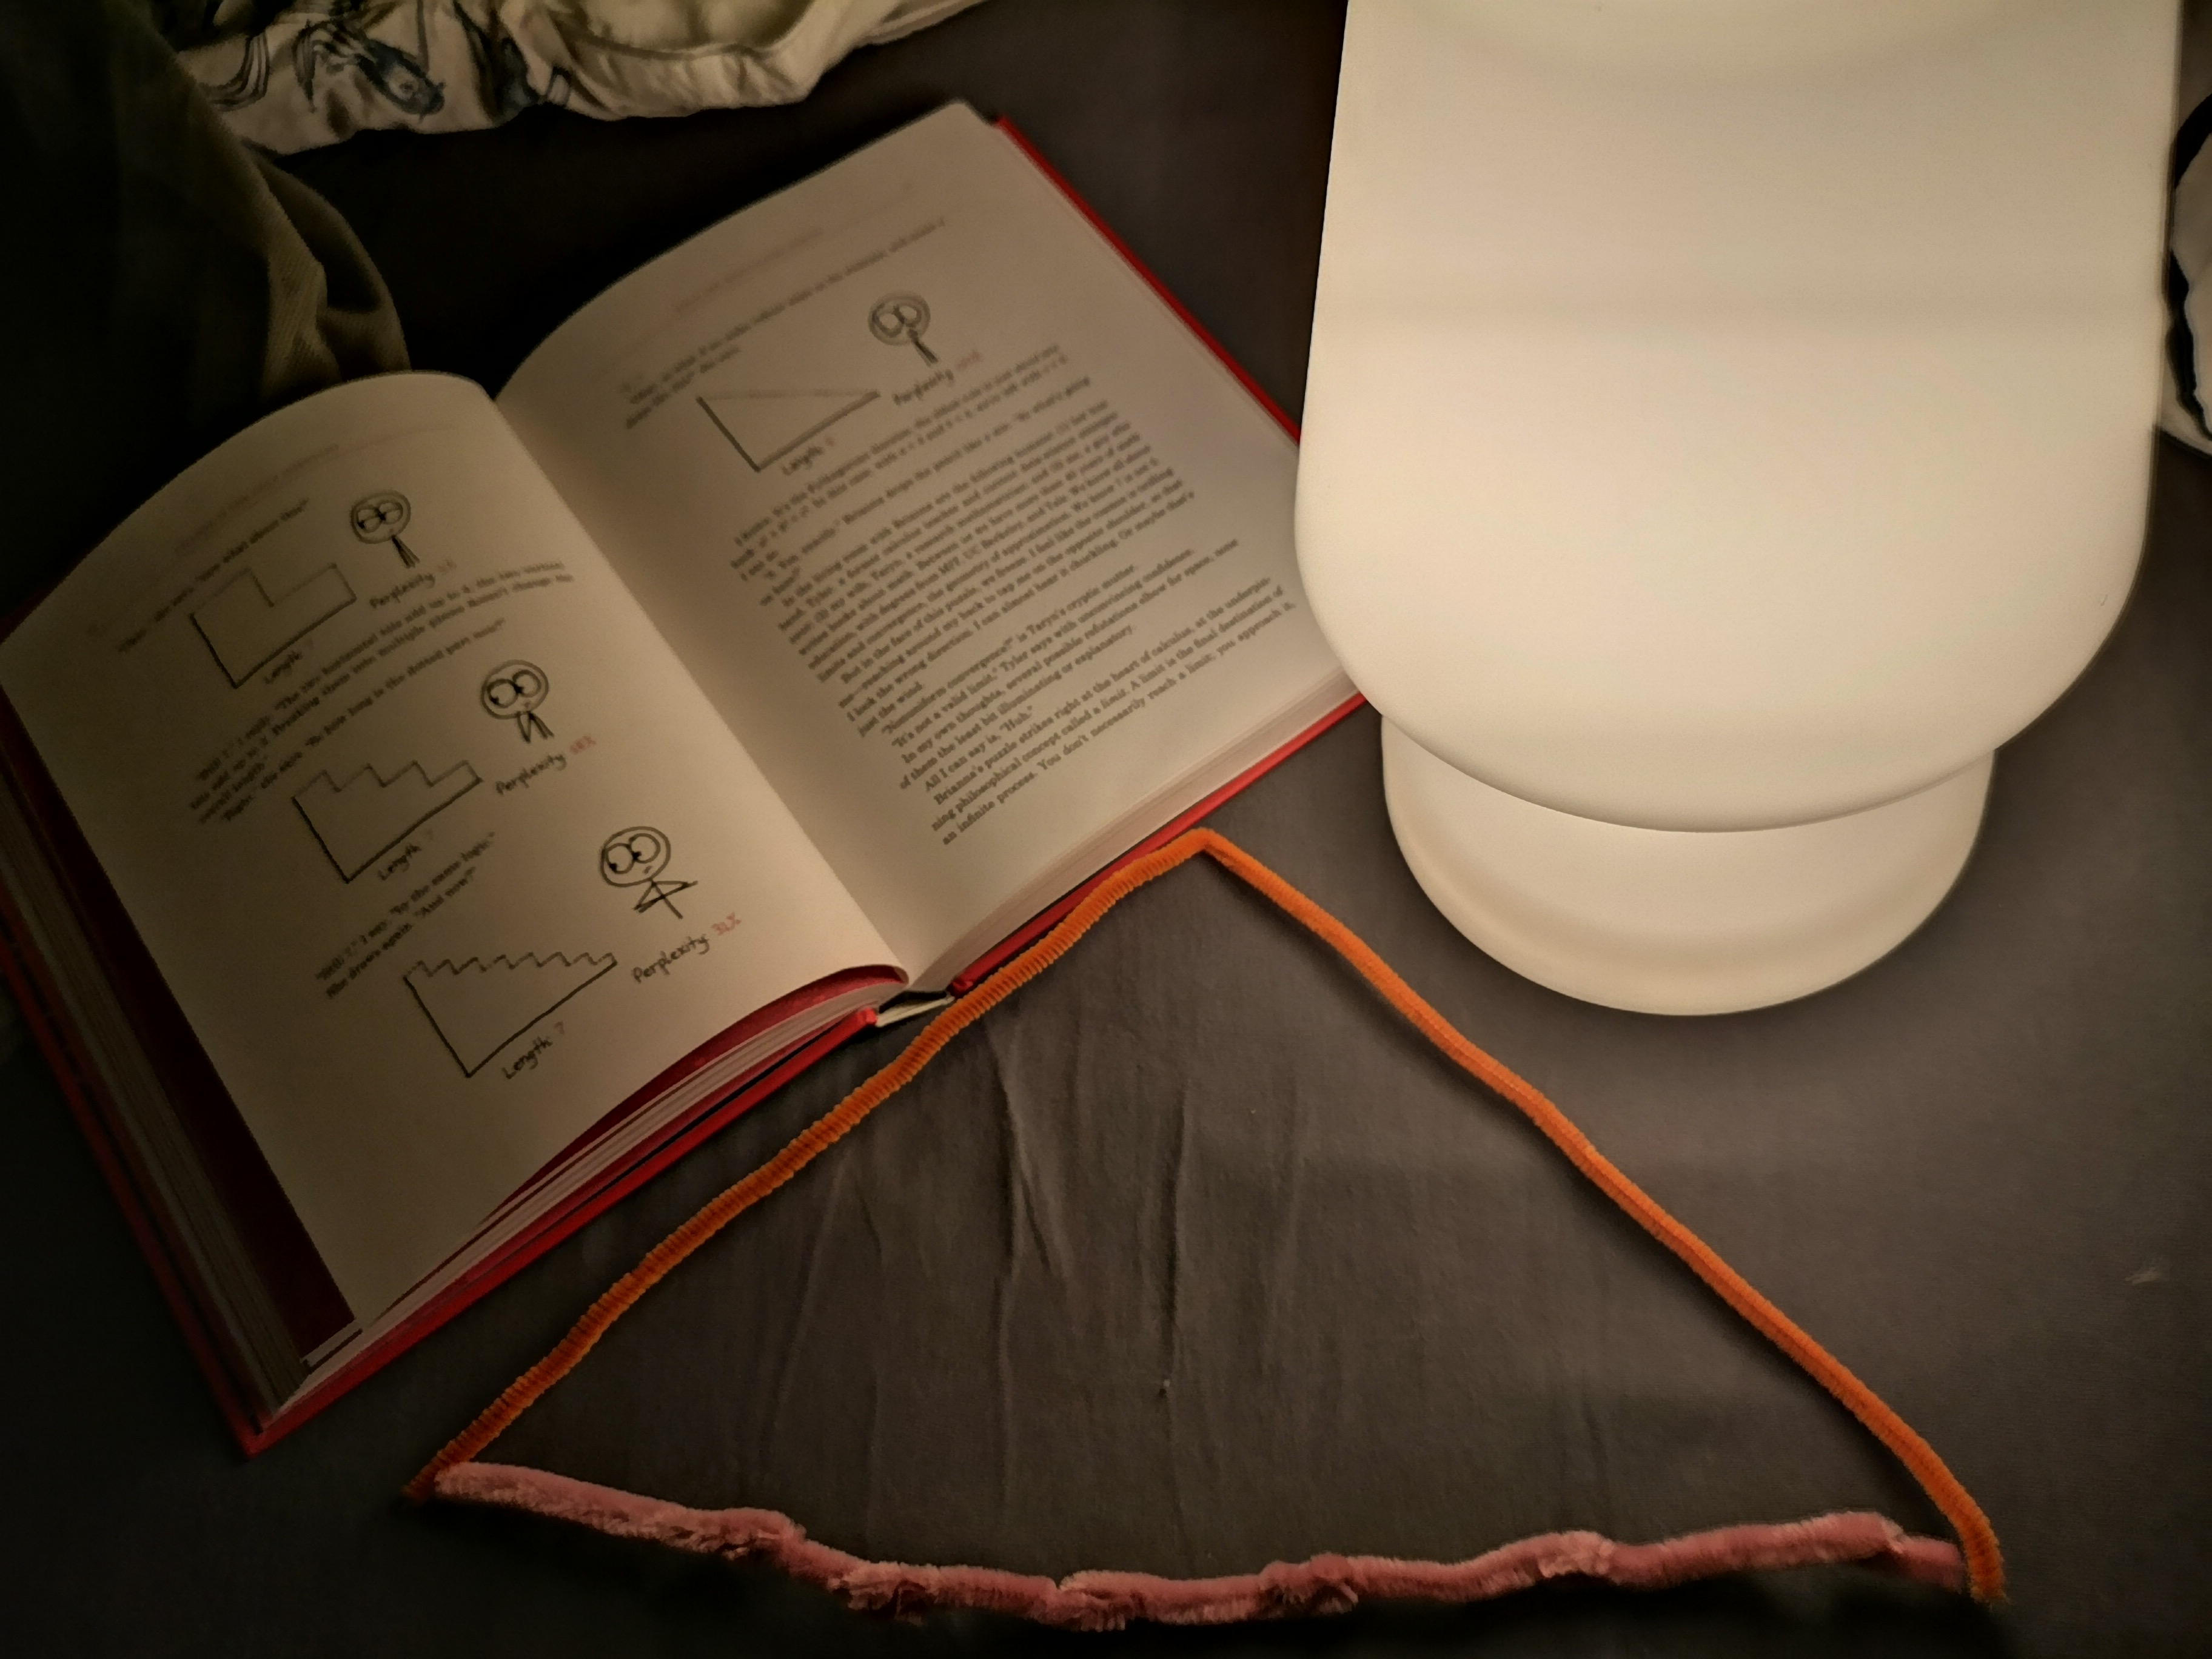
Below is one of Simon’s bedtime “doodles”, something he came up with when we were reading Ben Orlin’s Change is the Only Constant a couple of weeks ago. It was funny to see how Ben Orlin described a similar way to visualize the same rule later in the book.
Simon is devouring Ben Orlin’s book with intense pleasure. Or grief, if any analogy doesn’t seem logical to him, like in the chapter on Leo Tolstoy’s integration of history: Simon was very upset because it wasn’t clear to him what Orlin meant to put on the x axis – people or time? And how can we integrate discrete people? I suggested we view people as moments in time.
I think Ben Orlin is a kindred spirit, the way he visualizes everything and preaches against “shuffling back and forth with meaningless symbols”. “Education has a competitive zero-sum aspect, in which math functions as a sorting mechanism”, Orlin writes in his other beloved volume Math with Bad Drawings. “Math class took a beautiful, imaginative, logical art, shredded it into a bowl of confetti, and assigned students the impossible, mind-numbing task of piecing the original back together”. For Simon, who doesn’t do math classes but lives math, in the way it’s integrated into his daily experiences and self-directed learning through the plethora of resources available today, math is one and connected to everything, underlying everything. As Orlin rightfully puts it, math is a system of thinking, so for Simon it’s natural to hop between calculus and geometrical visualizations and Python code to problem solve. He immediately loses interest once asked to solve a particular problem using a specified method. Wasn’t that the reason why Richard Feynman hated math classes and loved math club?
Another math visualization Simon recently published:
