Simon has completed the course A New Kind of Science with Stephen Wolfram and the World Science Scholars program. Which doesn’t mean he is done with digging deep into Wolfram’s groundbreaking new kind of science! (As a matter of fact, he is still reading Wolfram’s 1500-page book. And as Professor Wolfram told Simon during the live session, there’s nothing in the book that no longer holds).

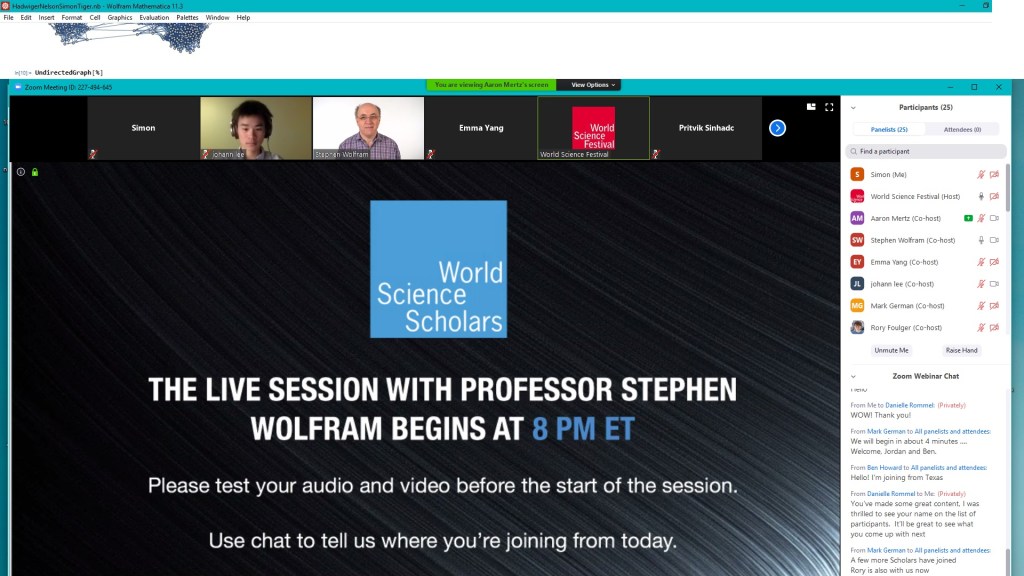
At the live session, a few scholars including Simon were planning to present their Wolfram Language demos, but Professor Wolfram was so inspired by his current research that he decided to share his latest discoveries instead (he is tiptoeing closer to laying the foundations of a theory that would unify all natural sciences based on his principle of computational equivalence). It was a very engaging session (even though Simon’s video camera malfunctioned, which hardly mattered).

As for Simon’s demo project, that’s a whole story. It took Simon weeks to define what he was actually going to pick as his topic and once he had picked his topic, he didn’t know where to start (because he managed to pick an NP problem). He suggested to collaborate together with another World Science Scholar, as it was that boy who initially inspired to think in the direction of the particular open math problem. The two of them had two long video chats. (It was so much fun to observe them, they both had zero interest in small talk and went straight down to the math, without even saying hi).


Unfortunately, after the original project presentation during the live session with Stephen Wolfram was cancelled, Simon’s partner never really replied to Simon’s chat messages (until weeks later). Simon did manage to get part of the demo done (porting a huge graph into the Wolfram Language, which required writing separate code in Python), but felt stuck later, after several attempts to color the graph failed. He ended up spending several days writing several more Python scripts. We have documented the process on video. The project has turned into a computational essay and it’s definitely still unfinished, but I’m not sure Simon will come back to it in the near future. He got a couple of minutes to present his findings at another live session last week (with a World Science Scholars teaching fellow Aaron Mertz and Rory Foulger, Education Outreach Coordinator at Wolfram Research), but was confused as he didn’t get any feedback about his findings and got the impression his main questions weren’t understood. He was also a bit annoyed with me yelling on the background about what he should do and say (I saw he was confused and was afraid his time would be cut short, so I wanted to make sure he would mention his main points). I’ve learned my lesson now and have decided not to interfere with his live performances anymore, not to put him under additional pressure.
Simon has also written to Professor Wolfram, currently awaiting his reply. His main questions were:
I was surprised to discover that no Heule or de Grey graphs exist (anymore?) built into the Wolfram Language. As part of my research, I’ve created a very long list of all the graphs the Wolfram Language knows about, and HeuleGraph is not in the list. I tried to pose this question during the short discussion of my project at the World Science Scholars live session this week, but didn’t get any feedback (I don’t think my question was understood). Yes, one is able to find images of Heule graphs in Wolfram notebooks, (like this one https://notebookarchive.org/heule-graph–2019-07-0z3zu9k/) and on Wolfram MathWorld (like here http://mathworld.wolfram.com/HeuleGraphs.html). But those are just pictures in archived notebooks, and even if I try to copy/paste the code into my own notebook, it doesn’t work.
My second question concerns coloring such a large graph in the Wolfram Language: do you think it could be possible? As I don’t know a built-in function to do that within the Wolfram Language (and I don’t think such a thing exists), I decided to try to color the graph in Python and then upload it into my Wolfram notebook. I created another Python script to make the graph easier to color, and yet another Python script to actually color all the vertices (using Breadth-First Search). The problem was: it didn’t color it with only 5 colors (but with 8)! I made a video about the making of the project, with me explaining why this task is hard for a computer to do, and even some computational complexity theory!
Timecodes: Converting to CSV: 0:00 Generating the Colors: 23:06 Some Math: 42:16 Part I Conclusion: 56:46
The project is attempting to visualize the Hadwiger–Nelson problem from geometric graph theory: what is the minimum number of colors required to color the plane (chromatic number of the plane) such that no two points at distance 1 from each other have the same color. It’s an unsolved problem, but we know that the answer is 5, 6 or 7. In 2018, Aubrey de Grey proved that the chromatic number of the plane is at least 5. His smallest unit-distance graph with chromatic number 5 had 1581 vertices. Several smaller graphs have been found since then, a major contribution done by Marijn Heule, who has come up with his own method of reducing the size of graphs. In 2019, Heule constructed the smallest unit-distance graph with chromatic number 5 so far, with 517 vertices. (Side-note: since I decided I’m going to use the 517 graph, I have actually found a smaller Heule graph with 508 vertices, but it was of a data format that I wasn’t able to use anyway). The goal of my project was to color such a graph in Wolfram language, to create a Wolfram Demo.
In Part 2, I tried to code yet another Python script to group the graph into smaller units to make a smaller graph, and color that one, then blow each vertex back into the unit considered.
Link to Simon’s Wolfram Notebook: https://www.wolframcloud.com/obj/9795e37e-aa73-4ae6-8249-81223ffdbc7f Link to my code on GitHub: https://github.com/simon-tiger/Hadwiger-Nelson-Project-Data


Link to Marijn Heule’s paper “Computing Small Unit-Distance Graphs with Chromatic Number 5”: https://arxiv.org/pdf/1805.12181.pdf
