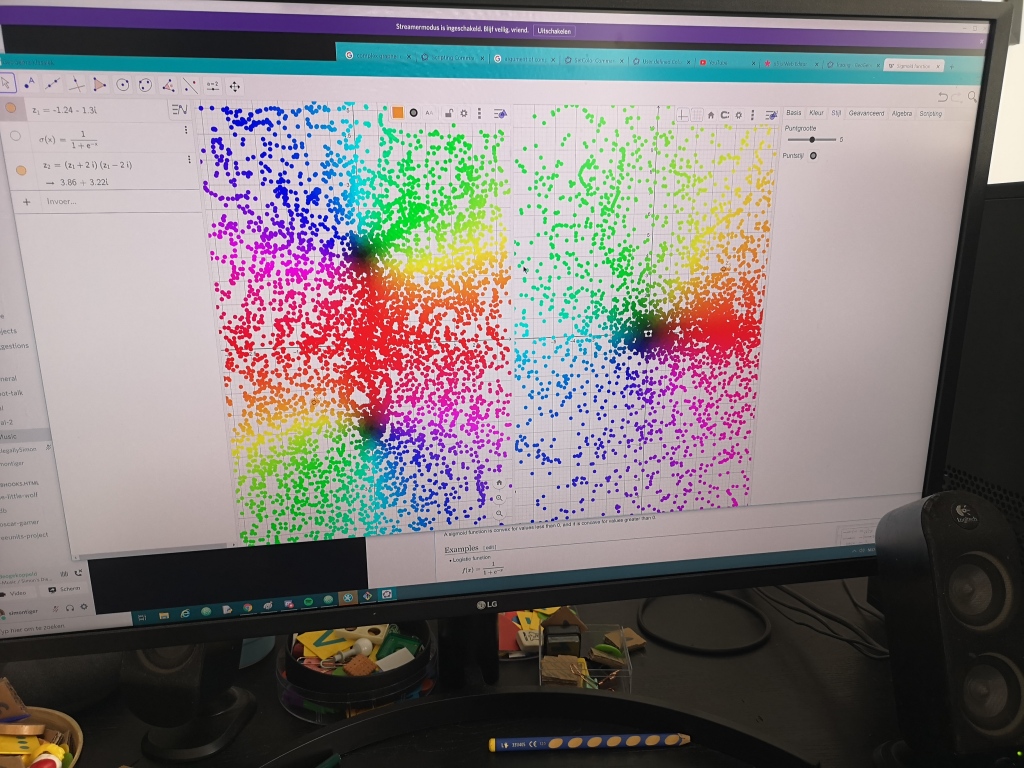
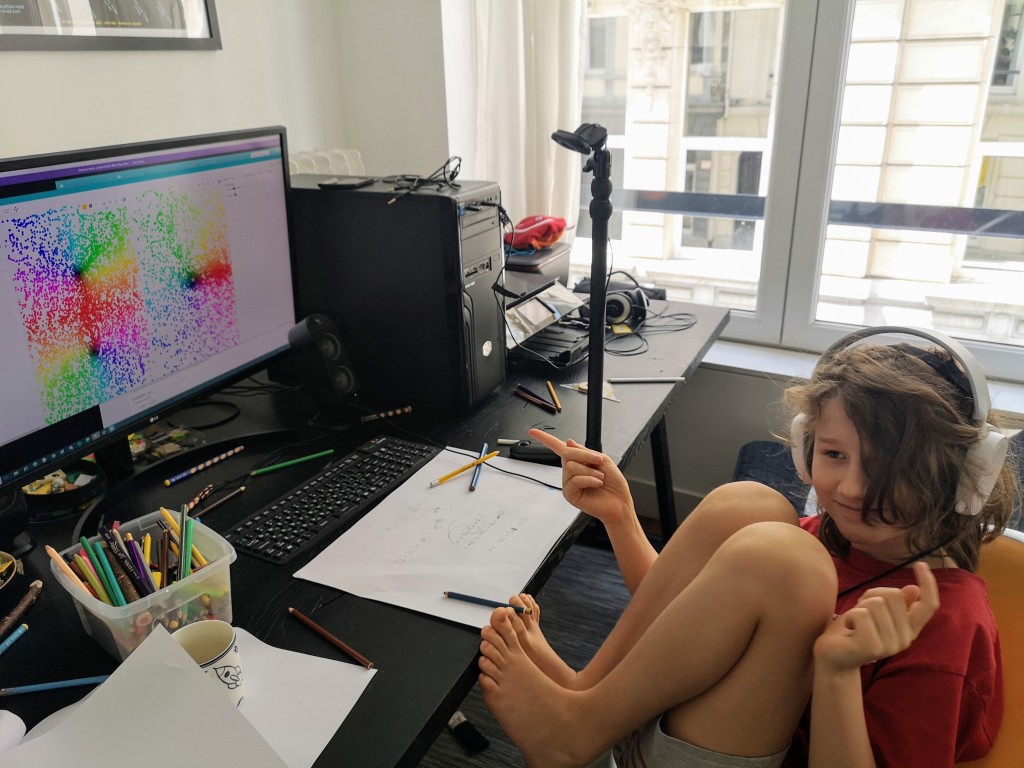
Simon’s made this amazing complex number function graph in GeoGebra! Follow the link to play with it here.
Just scribble on the screen by dragging the z1 dot around with your mouse. Black dots is where it maps to zero, white dots don’t exist. You can use any function to make this graph.


This is awesome! Thanks for sharing! 🙂
https://mathsux.org/
LikeLiked by 1 person