This random number generator Simon built in Processing simultaneously graphs the probability of the values as you “throw the dice”. This is Simon’s own code and what’s more, he has turned it into a truly scientific experiment/observation. Simon programmed the generator to automatically throw the dice every 60 frames a second (i.e. every 1/15th of a second). The graph showing the probability of certain values should increasingly resemble a perfect isoceles triangle the more throws occur, because the probability of you getting 7 is much higher than those of getting 2 or 12.
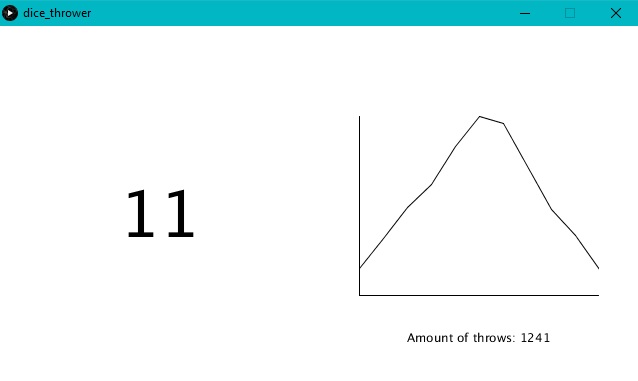
The perfect triangle was drawn at around 4000 throws.
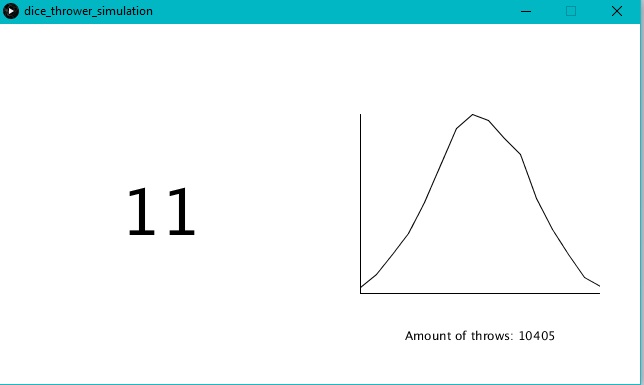
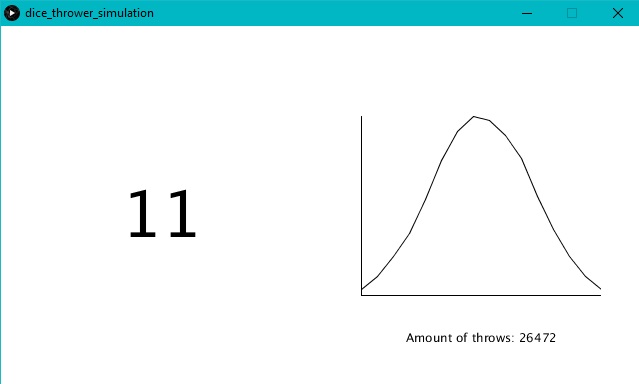
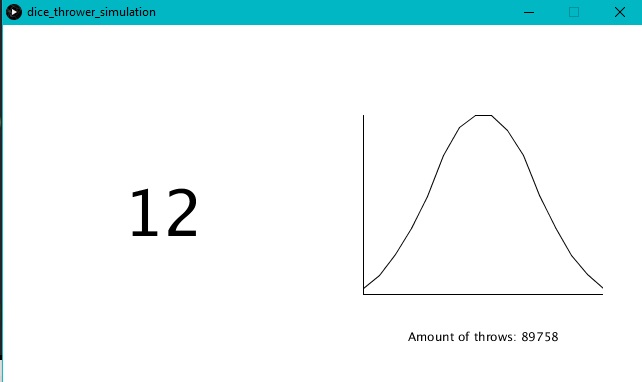
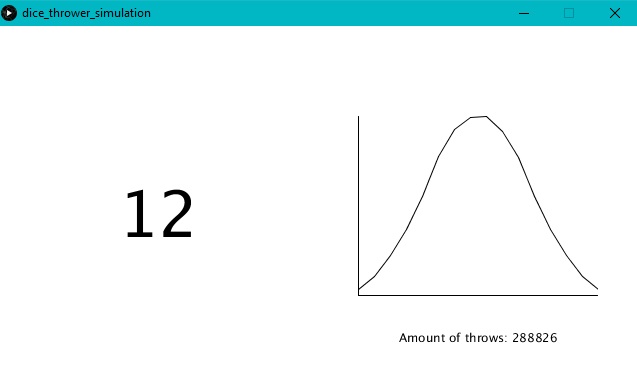
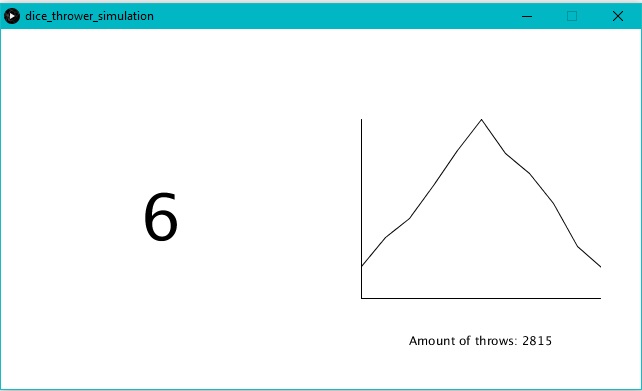
Simon also experimented with programming the same generator for 3 dice. The graph should then form a bell shaped curve, a parabola, and takes a longer while to shape up. “As the number of dice grows towards infinity, the distribution will change from a uniform distribution to a Gaussian distribution”, – Simon explains.