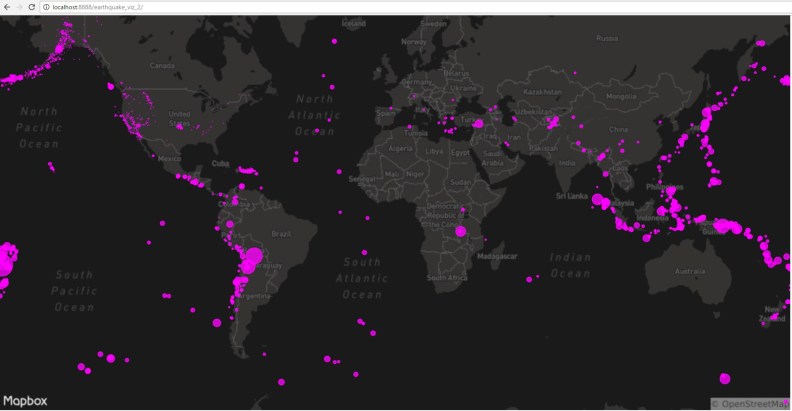
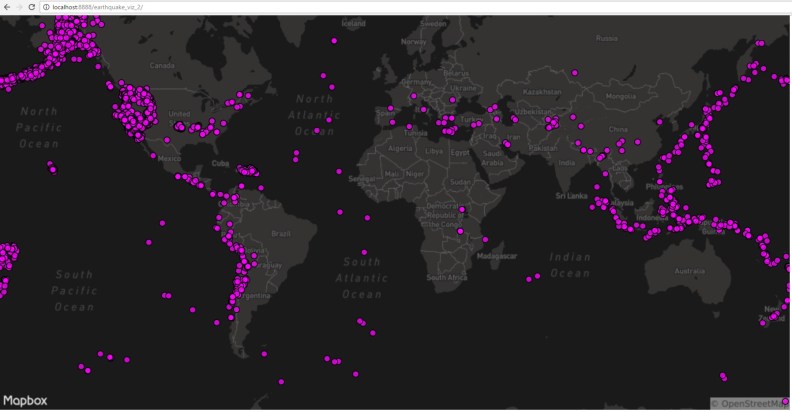
On Friday Simon finished another beautiful Daniel Shiffman coding challenge called Mapping Earthquake Data. The purpose of this coding challenge was to visualize earthquake data from the USGS website (http://earthquake.usgs.gov/data/) by mapping the latitude, longitude and the magnitude of earthquakes with p5.js. The map imagery is pulled from mapbox.js and the math demonstrated coverts latitude, longitude to x,y via Web Mercator (the de facto standard for web mapping applications).
In Web Mercator, the “world coordinates” are adjusted such that the upper left corner is (0, 0) and the lower right corner is (256, 256). To visualize a place on the map, its coordinates are calculated with the help of this crazy formula:
![{\begin{aligned}x&={\frac {128}{\pi }}2^{\text{zoom level}}(\lambda +\pi ){\text{ pixels}}\\y&={\frac {128}{\pi }}2^{\text{zoom level}}\left(\pi -\ln \left[\tan \left({\frac {\pi }{4}}+{\frac {\varphi }{2}}\right)\right]\right){\text{ pixels}}\end{aligned}}](https://wikimedia.org/api/rest_v1/media/math/render/svg/3e5240c35bde180226b268aa4de4e4cde3b95ed3)
where λ is the longitude in radians and φ is latitude in radians.
Daniel Shiffman turned parts of the formula into a, b and c to make it easier to apply it within the code. The coordinates he got as the result should then be subtracted from the center of the screen. Simon first forgot to do that subtraction bit and his Shanghai ended up outside the screen, which caused a lot of tears. The next day, after a long search, he found the problem.
And his math tutor explained what logarithms are.